
|
Physical Oceanography Group School of Marine Sciences University of Maine |
|
|
|
Physical Oceanography Group School of Marine Sciences University of Maine |
|
|
Latitude: 43° 29.44´N Longitude: 67° 52.79´W Location Description: Deployed: Jun 28 2017 Recovered: Jul 09 2018 Coast Guard Light List Letter: M Coast Guard Light List Number 6 Water Depth: 285 meters (935 feet) Watch Circle Radius: 55 meters (180 feet) Last Cell Phone Transmission: Jul 09, 08 AM EDT Last GOES Transmission: May 16, 01 AM EDT Latest Event: Jul 09, 08 AM EDT
recovered by R/V Connecticut |
|
|
Text Reports: Surface, Ocean, Currents OR Data Download (All data for this location)
Sensor Information (this deployment only)
Click on the graph icons below to see time series plots of the listed variables. The latest conditions are in local time but all plots are in GMT(Summer EDT is 4 hours behind GMT; Winter EST is 5 hours behind GMT; Atlantic AST is always 4 hours behind GMT).
We follow the convention that depth is measure positive "down". That's why parameters like wind speed have negative depths attached to them! The latest eastward and northward subsurface currents are displayed at a subset of available depths; no plots are presently available for current velocity vectors below 2m. Click here for additional Information.
| Variable (measurement depth in meters) | Last Observation |
Last Update (GMT) |
Full Deployment Plot |
|
|---|---|---|---|---|
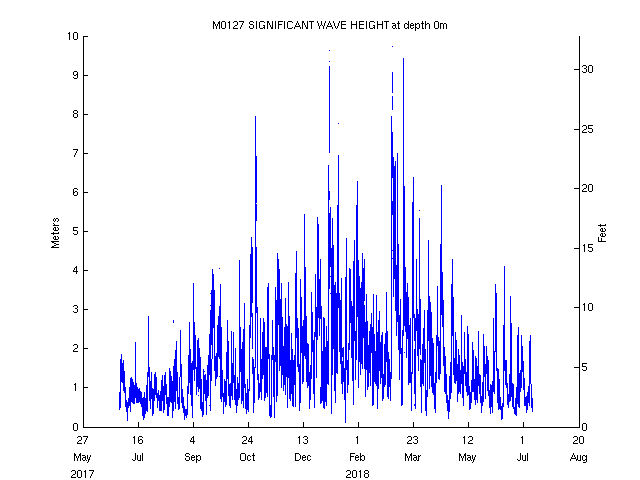
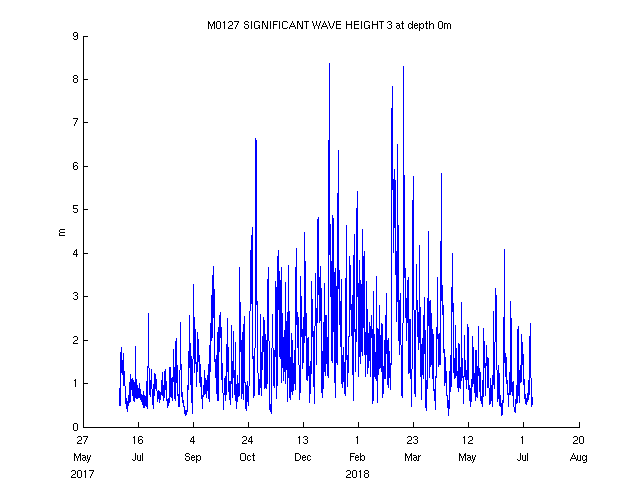
| Significant Wave Height (0m) | 1.0 meters (3.2 ft) | 2018 Jul 09 12:30 PM |
|

|
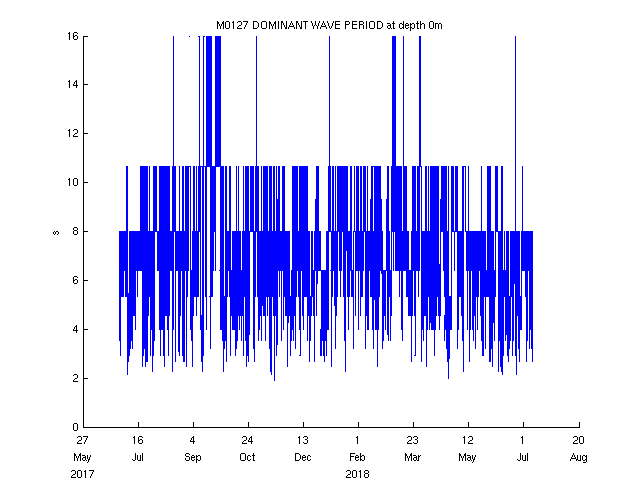
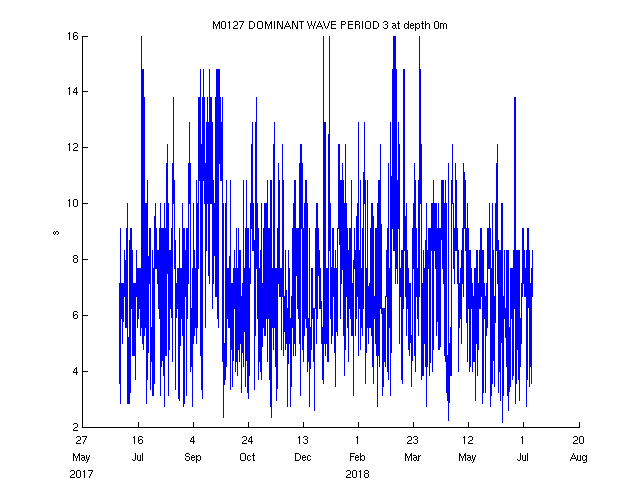
| Dominant Wave Period (0m) | 4.6 seconds | 2018 Jul 09 12:30 PM |
|
|
| Significant Wave Height (test) (0m) | 1.0 meters (3.2 ft) | 2018 Jul 09 12:00 PM |
|
|
| Dominant Wave Period (test) (0m) | 4.5 seconds | 2018 Jul 09 12:00 PM |
|
|
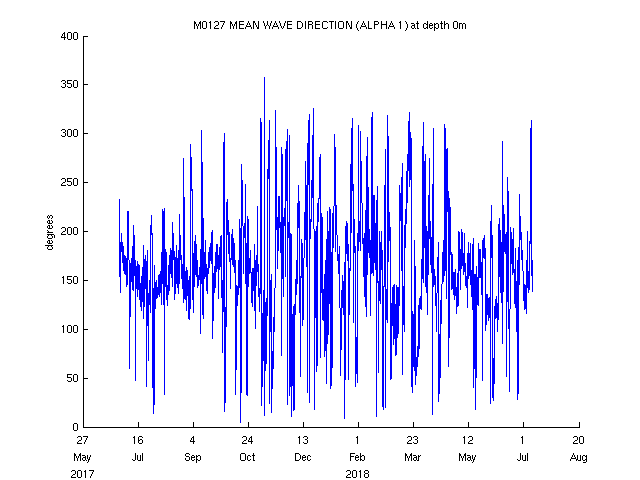
| Mean Wave Direction (test) (0m) | 222.1 degrees | 2018 Jul 09 12:00 PM |
|
|
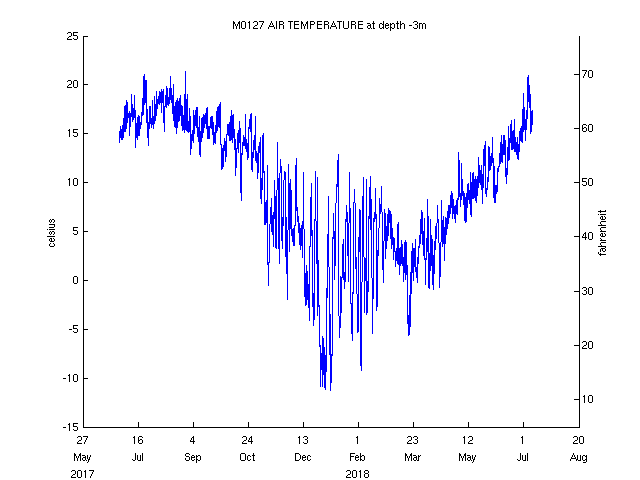
| Air Temperature (-3m) | 16.8 C (62.2 F) | 2018 Jul 09 12:30 PM |
|
|
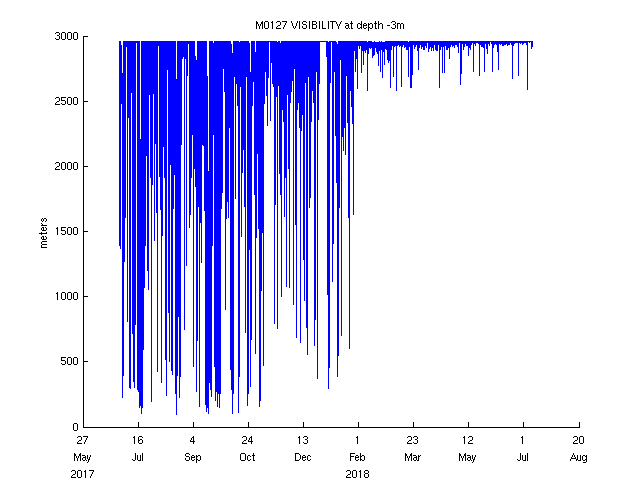
| Visibility (-3m) | 2958.5 meters | 2018 Jul 09 12:30 PM |
|
|
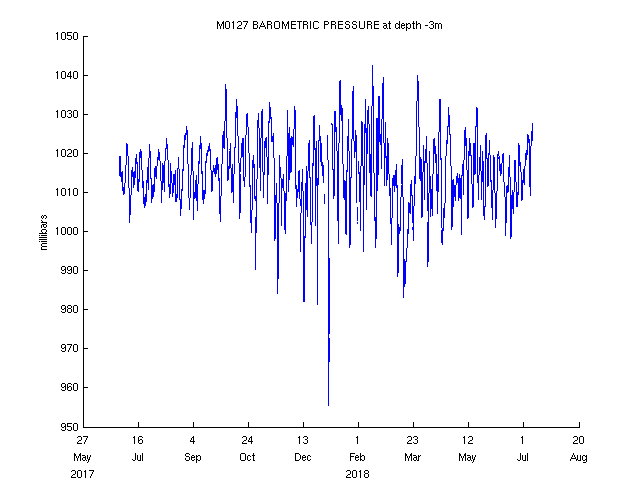
| Barometric Pressure (-3m) | 1020.7 millibars | 2018 Jul 09 12:30 PM |
|
|
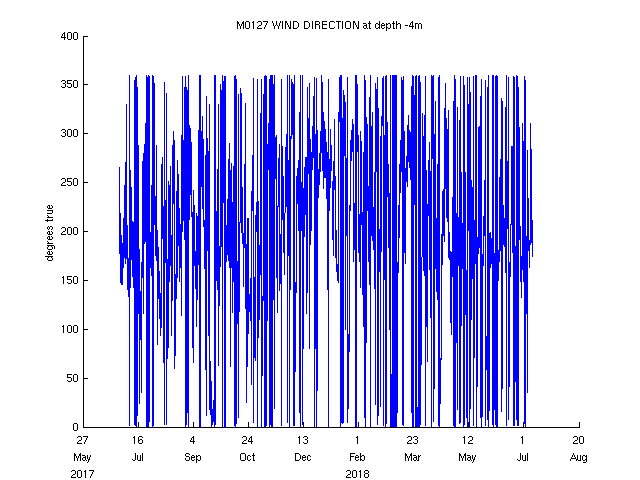
| Wind Direction [Primary] (-4m) | South | 2018 Jul 09 12:30 PM |
|
|
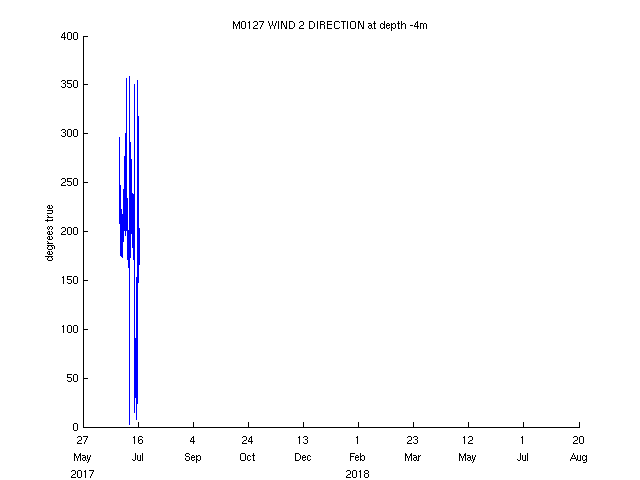
| Wind 2 Direction (-4m) | Sensor Failure | 2018 Jul 09 12:30 PM |
|
|
| Wind Speed [Primary] (-4m) | 7.2 m/s (16 mph, 14 kts) | 2018 Jul 09 12:30 PM |
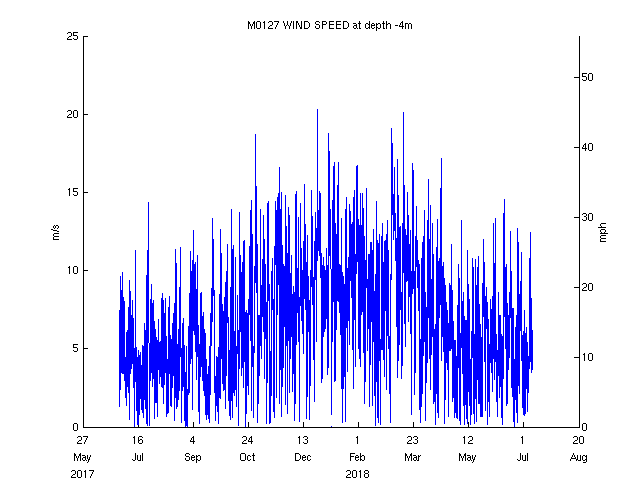
|
|
| Wind 2 Speed (-4m) | Sensor Failure | 2018 Jul 09 12:30 PM |
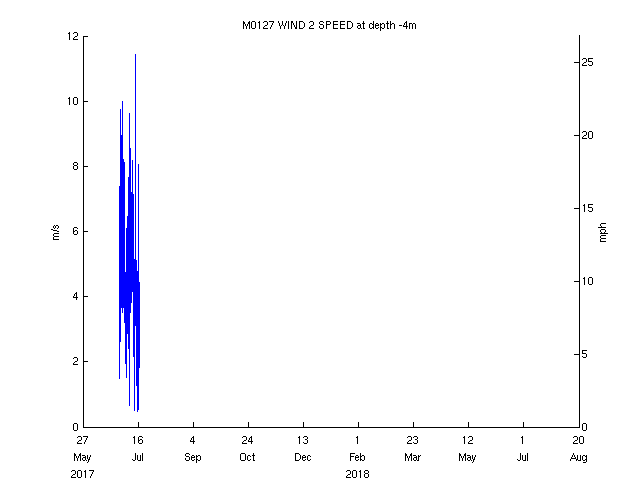
|
|
| Wind Gust [Primary] (-4m) | 8.6 m/s (19 mph, 17 kts) | 2018 Jul 09 12:30 PM |
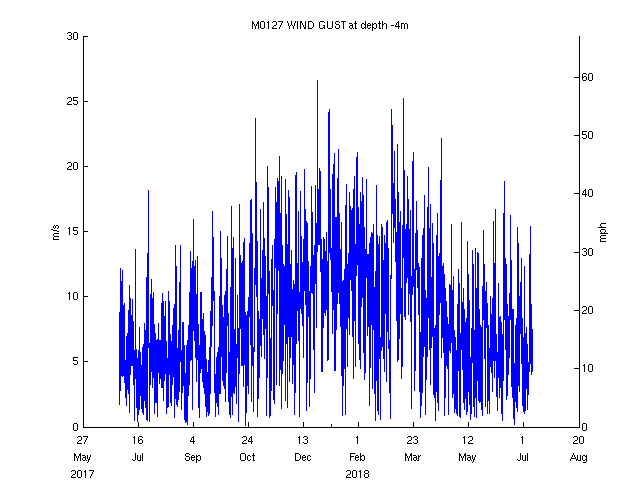
|
|
| Wind 2 Gust (-4m) | Sensor Failure | 2018 Jul 09 12:30 PM |
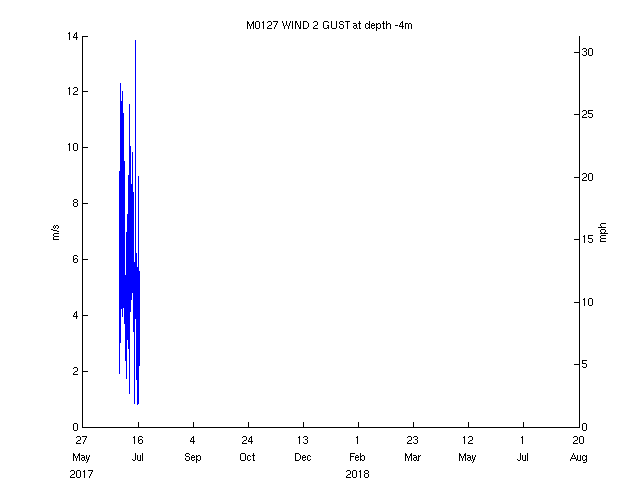
|
|
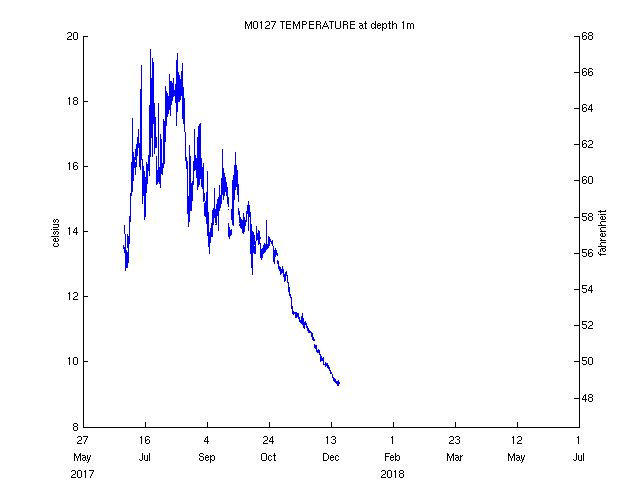
| Water Temperature (1m) | Sensor Failure | 2018 May 16 5:00 AM |
|
|
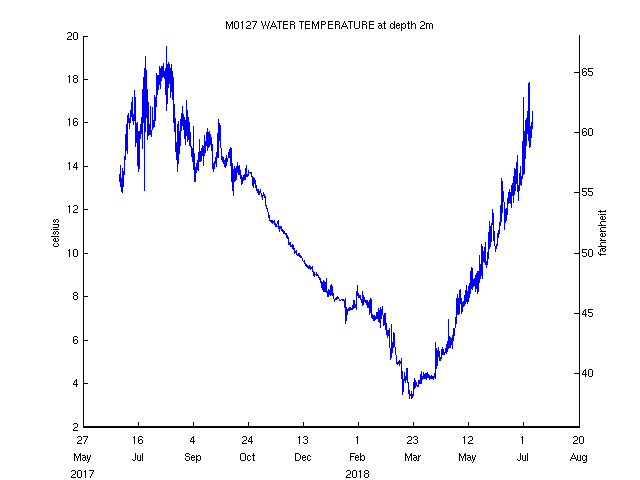
| Water Temperature (2m) | 15.9 C (60.6 F) | 2018 Jul 09 12:00 PM |
|
|
| Water Temperature (3m) | 15.8 C (60.5 F) | 2018 Jul 09 12:00 PM |
|
|
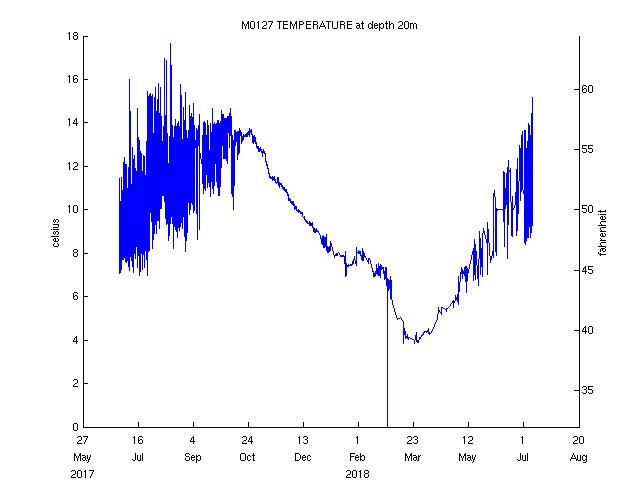
| Water Temperature (20m) | 9.9 C (49.8 F) | 2018 Jul 09 12:00 PM |
|
|
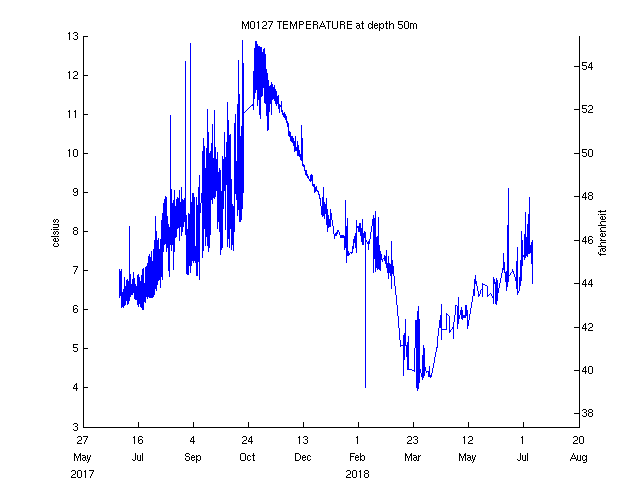
| Water Temperature (50m) | 7.2 C (45.0 F) | 2018 Jul 09 12:00 PM |
|
|
| Water Temperature (100m) | 7.1 C (44.8 F) | 2018 Jul 09 12:00 PM |
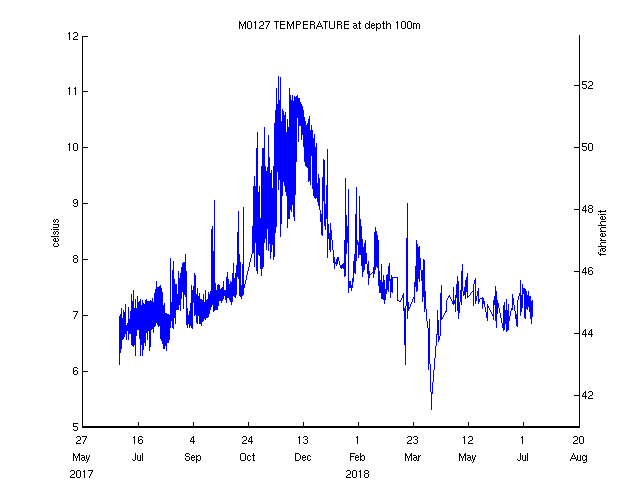
|
|
| Water Temperature (150m) | 7.3 C (45.1 F) | 2018 Jul 09 12:00 PM |
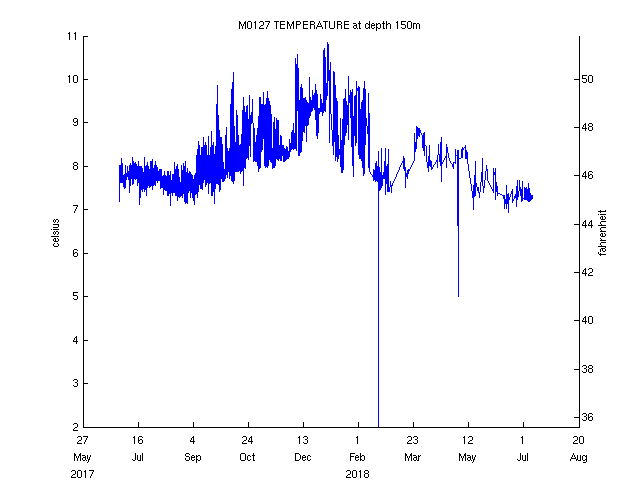
|
|
| Water Temperature (200m) | 7.8 C (46.0 F) | 2018 Jul 09 12:00 PM |
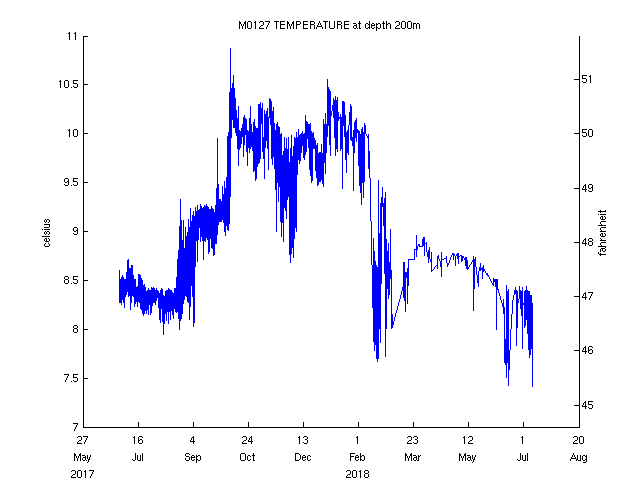
|
|
| Water Temperature (250m) | 8.4 C (47.2 F) | 2018 Jul 09 12:09 PM |
|
|
| Salinity (1m) | Sensor Failure | 2018 May 16 5:00 AM |
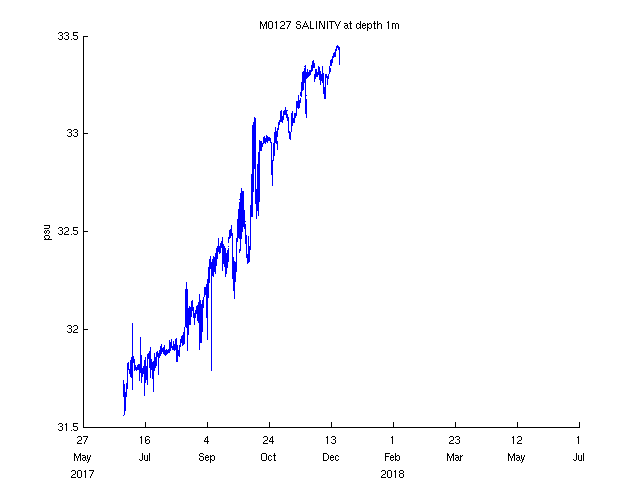
|
|
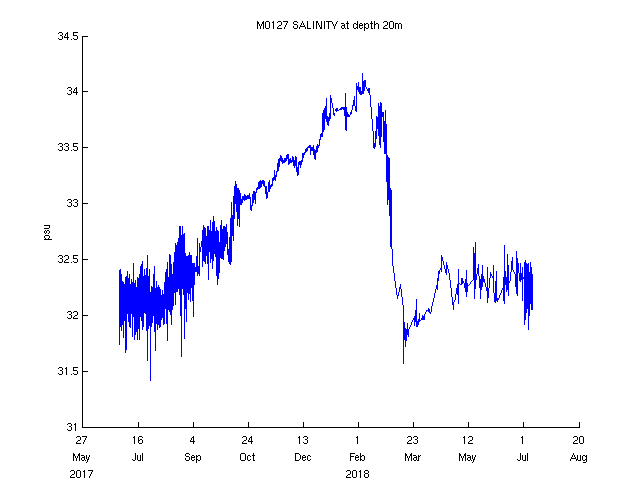
| Salinity (20m) | 32.3 psu | 2018 Jul 09 12:00 PM |
|
|
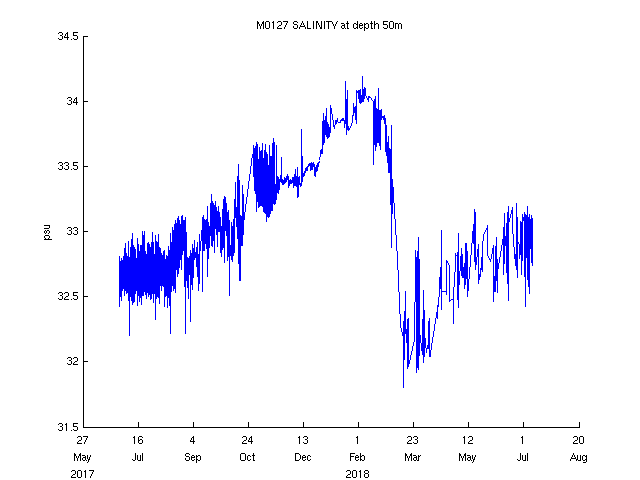
| Salinity (50m) | 33.0 psu | 2018 Jul 09 12:00 PM |
|
|
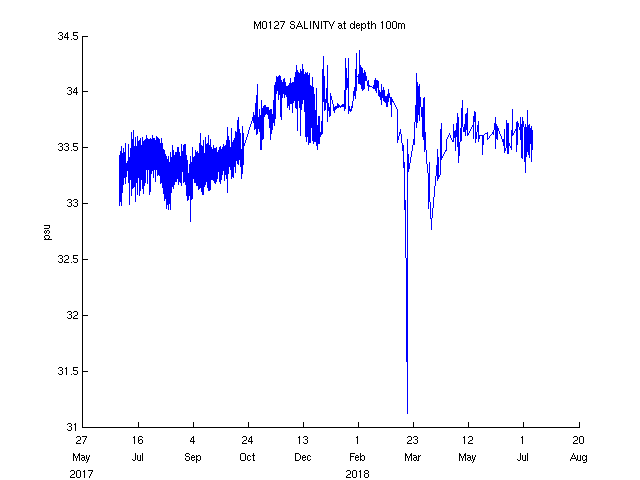
| Salinity (100m) | 33.5 psu | 2018 Jul 09 12:00 PM |
|
|
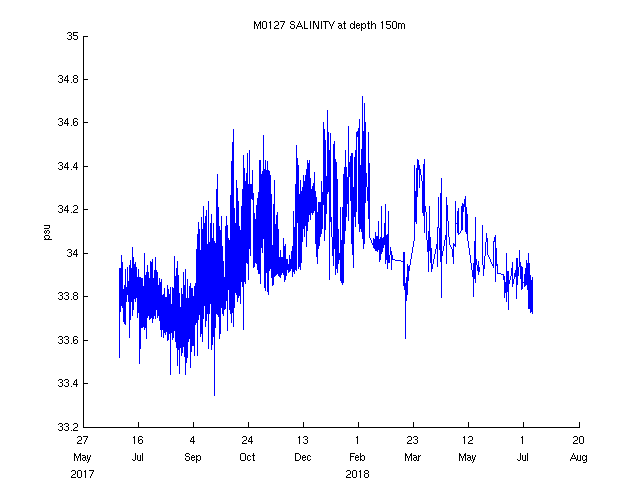
| Salinity (150m) | 33.8 psu | 2018 Jul 09 12:00 PM |
|
|
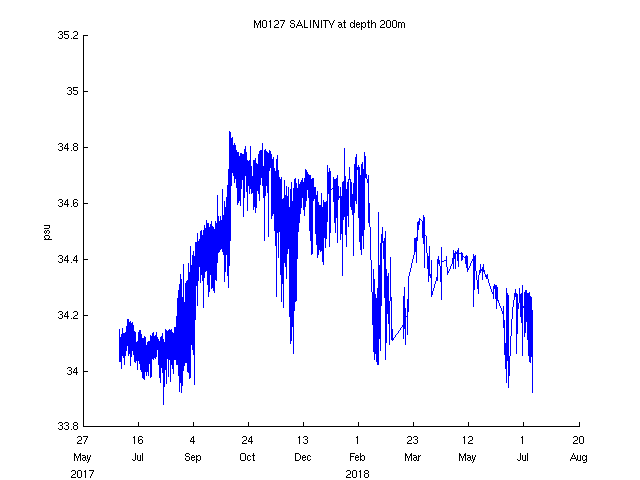
| Salinity (200m) | 34.0 psu | 2018 Jul 09 12:00 PM |
|
|
| Salinity (250m) | 32.1 psu | 2018 Jul 09 12:09 PM |
|
|
| Pressure (250m) | 249.3 decibars | 2018 Jul 09 12:09 PM |
|
|
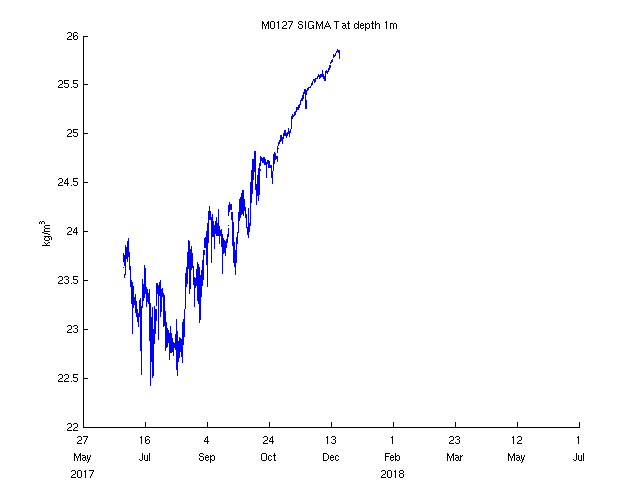
| Sigma-T (1m) | Sensor Failure | 2018 May 16 5:00 AM |
|
|
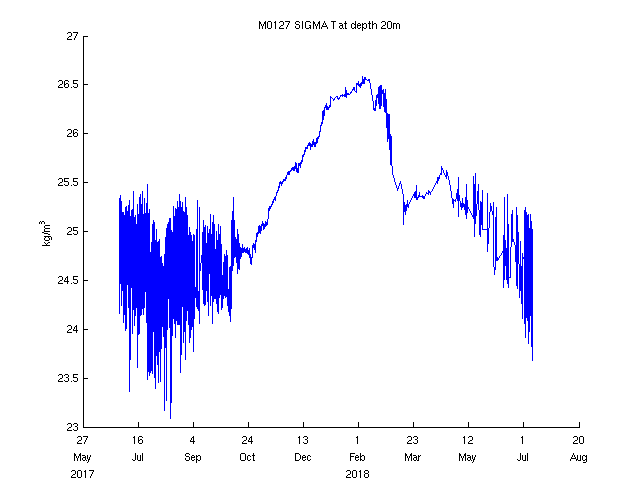
| Sigma-T (20m) | 24.9 kg/m^3 | 2018 Jul 09 12:00 PM |
|
|
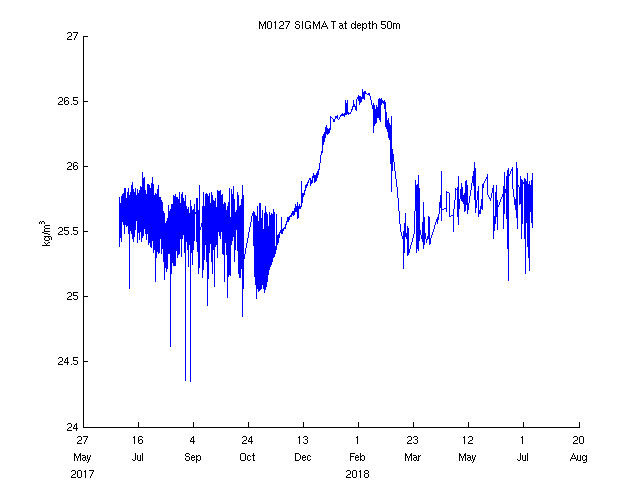
| Sigma-T (50m) | 25.8 kg/m^3 | 2018 Jul 09 12:00 PM |
|
|
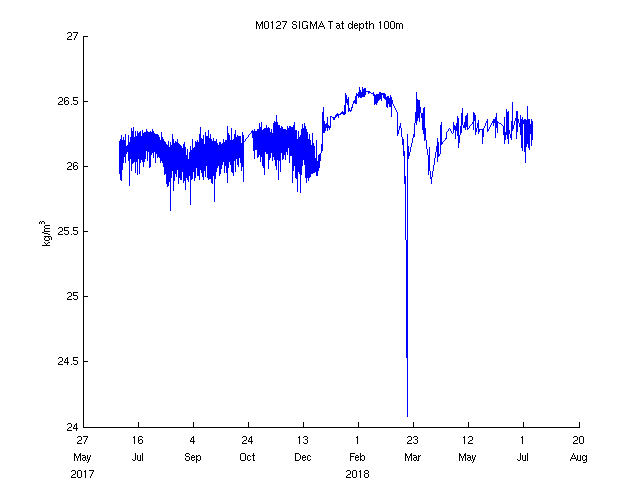
| Sigma-T (100m) | 26.3 kg/m^3 | 2018 Jul 09 12:00 PM |
|
|
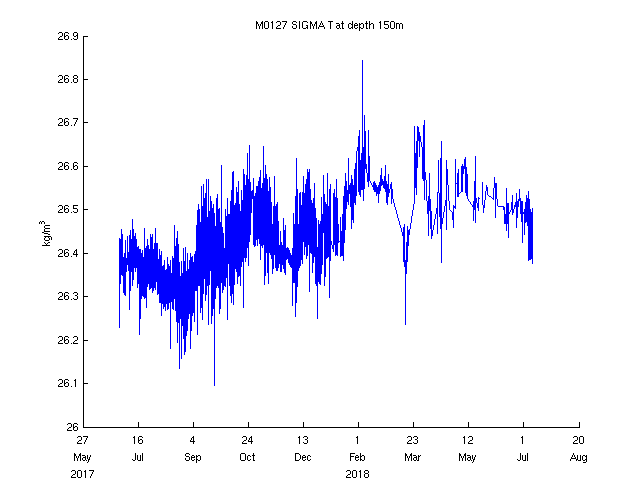
| Sigma-T (150m) | 26.5 kg/m^3 | 2018 Jul 09 12:00 PM |
|
|
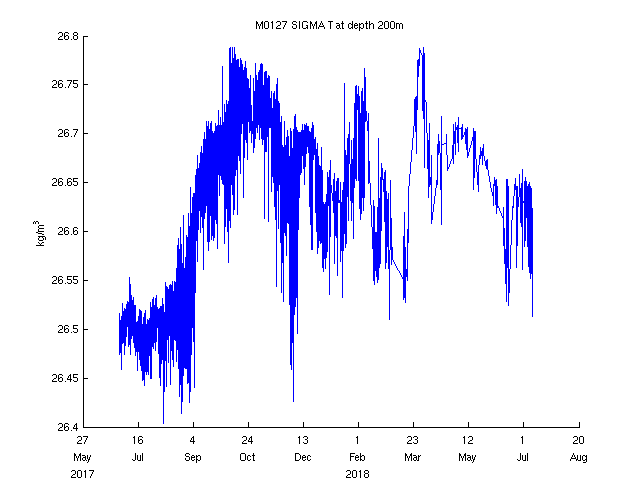
| Sigma-T (200m) | 26.6 kg/m^3 | 2018 Jul 09 12:00 PM |
|
|
| Sigma-T (250m) | 24.9 kg/m^3 | 2018 Jul 09 12:09 PM |
|
|
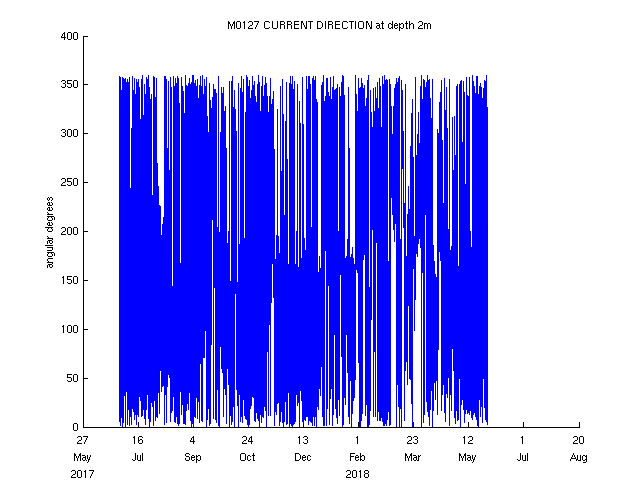
| Current Direction (2m) | Sensor Failure | 2018 Jul 09 12:00 PM |
|
|
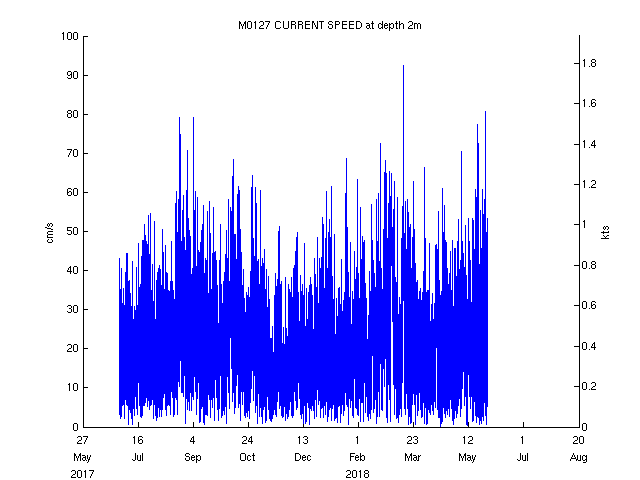
| Current Speed (2m) | Sensor Failure | 2018 Jul 09 12:00 PM |
|
|
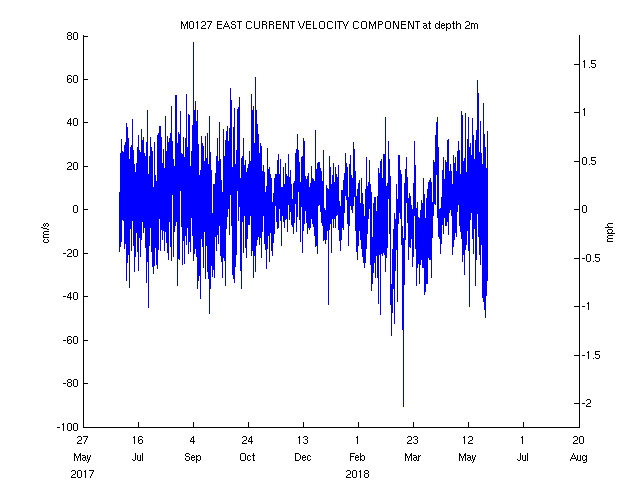
| East Current Velocity (2m) | Sensor Failure | 2018 Jul 09 12:00 PM |
|
|
| East Current Velocity (18m) | -10.4 cm/s (-0.20 kts) | 2018 Jul 09 12:00 PM |
|
|
| East Current Velocity (50m) | -1.0 cm/s (-0.02 kts) | 2018 Jul 09 12:00 PM |
|
|
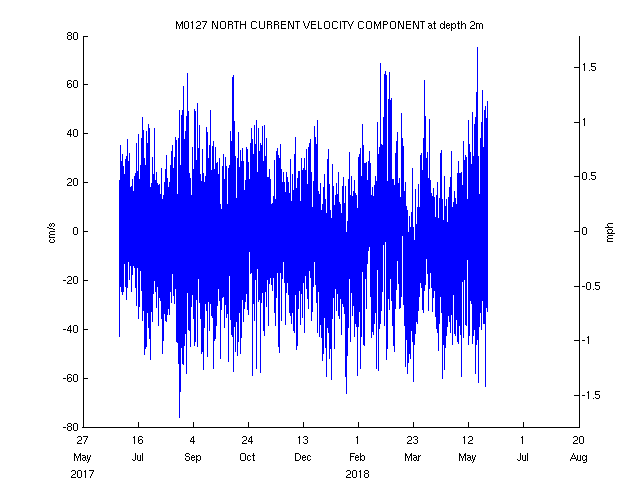
| North Current Velocity (2m) | Sensor Failure | 2018 Jul 09 12:00 PM |
|
|
| North Current Velocity (18m) | 15.1 cm/s (0.29 kts) | 2018 Jul 09 12:00 PM |
|
|
| North Current Velocity (50m) | -8.0 cm/s (-0.15 kts) | 2018 Jul 09 12:00 PM |
|
|
| Average Chlorophyll Concentration (1m) | NA | NA |

|
|
| Average Chlorophyll Concentration (20m) | NA | NA |

|
|
| Sea water Turbidity (1m) | NA | NA |

|
|
| Sea water Turbidity (20m) | NA | NA |

|
|
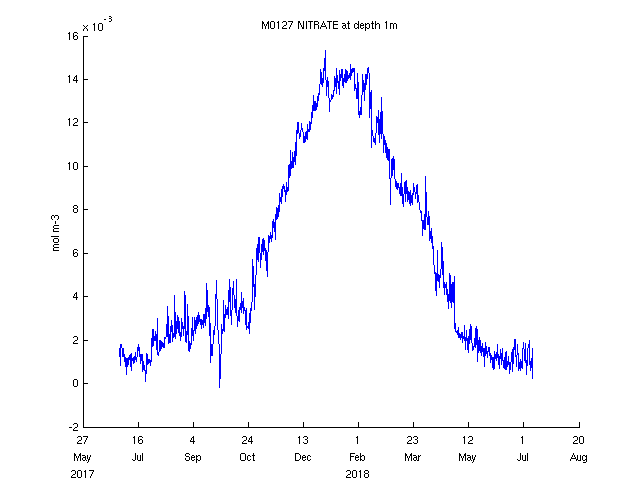
| Nitrate Concentration (1m) | 0.0005 mol m-3 (0.5 uM) | 2018 Jul 09 9:00 AM |
|
|
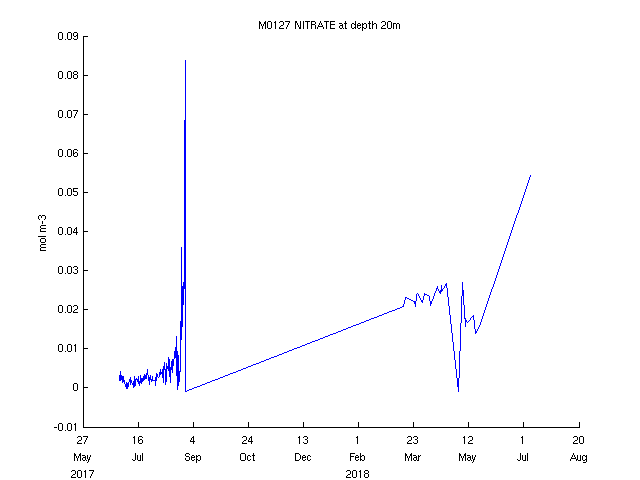
| Nitrate Concentration (20m) | 0.0542 mol m-3 (54.2 uM) | 2018 Jul 07 9:00 AM |
|
|
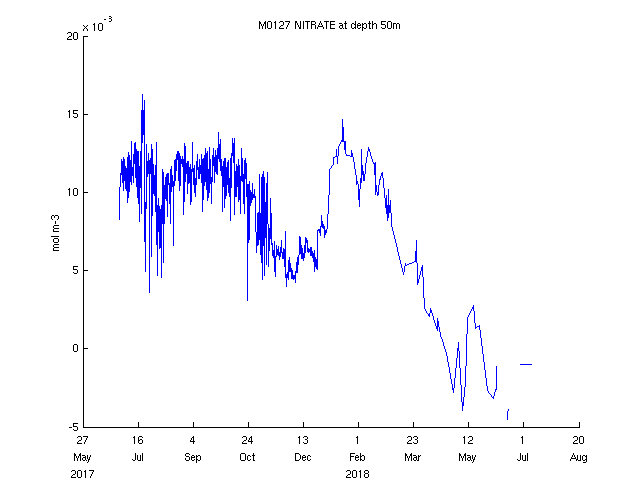
| Nitrate Concentration (50m) | -0.0010 mol m-3 (-1.0 uM) | 2018 Jul 07 5:00 PM |
|
|
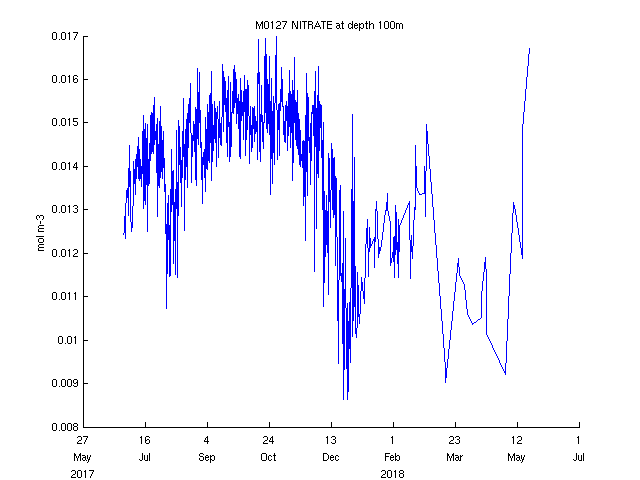
| Nitrate Concentration (100m) | 0.0167 mol m-3 (16.7 uM) | 2018 May 21 5:00 PM |
|
|
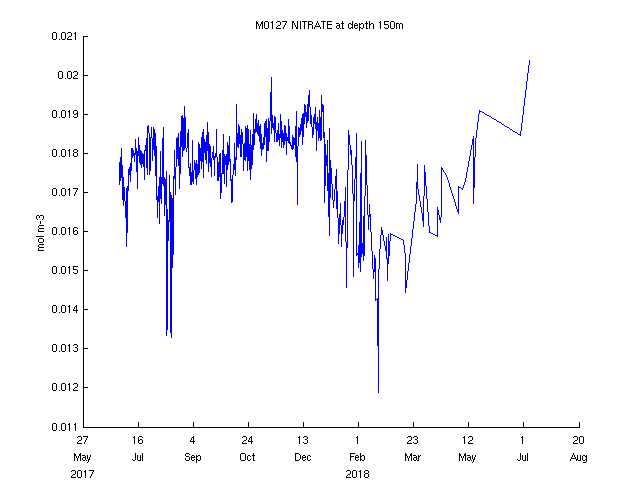
| Nitrate Concentration (150m) | 0.0204 mol m-3 (20.4 uM) | 2018 Jul 05 5:00 PM |
|
|
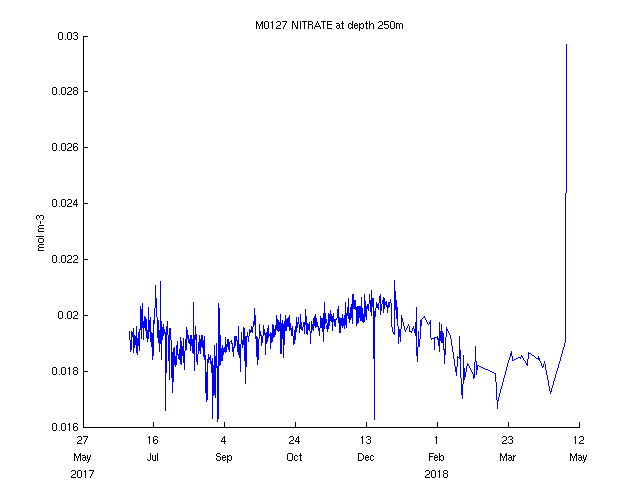
| Nitrate Concentration (250m) | 0.0297 mol m-3 (29.7 uM) | 2018 May 03 1:00 AM |
|
|
 This Deployment:
|
 This Deployment:
|
| NERACOOS Home | Latest Buoy Data | U.Maine Buoys | U.Maine CODAR | GOM Weather | GOM Wave Modeling | Related Links | Software | Mooring Group | PhOG home |